
Hydrology
35% weightLow
A real report, from the overall signal to the evidence worth checking next.
34.276300, -119.303000 · California · Generated · 64 pages
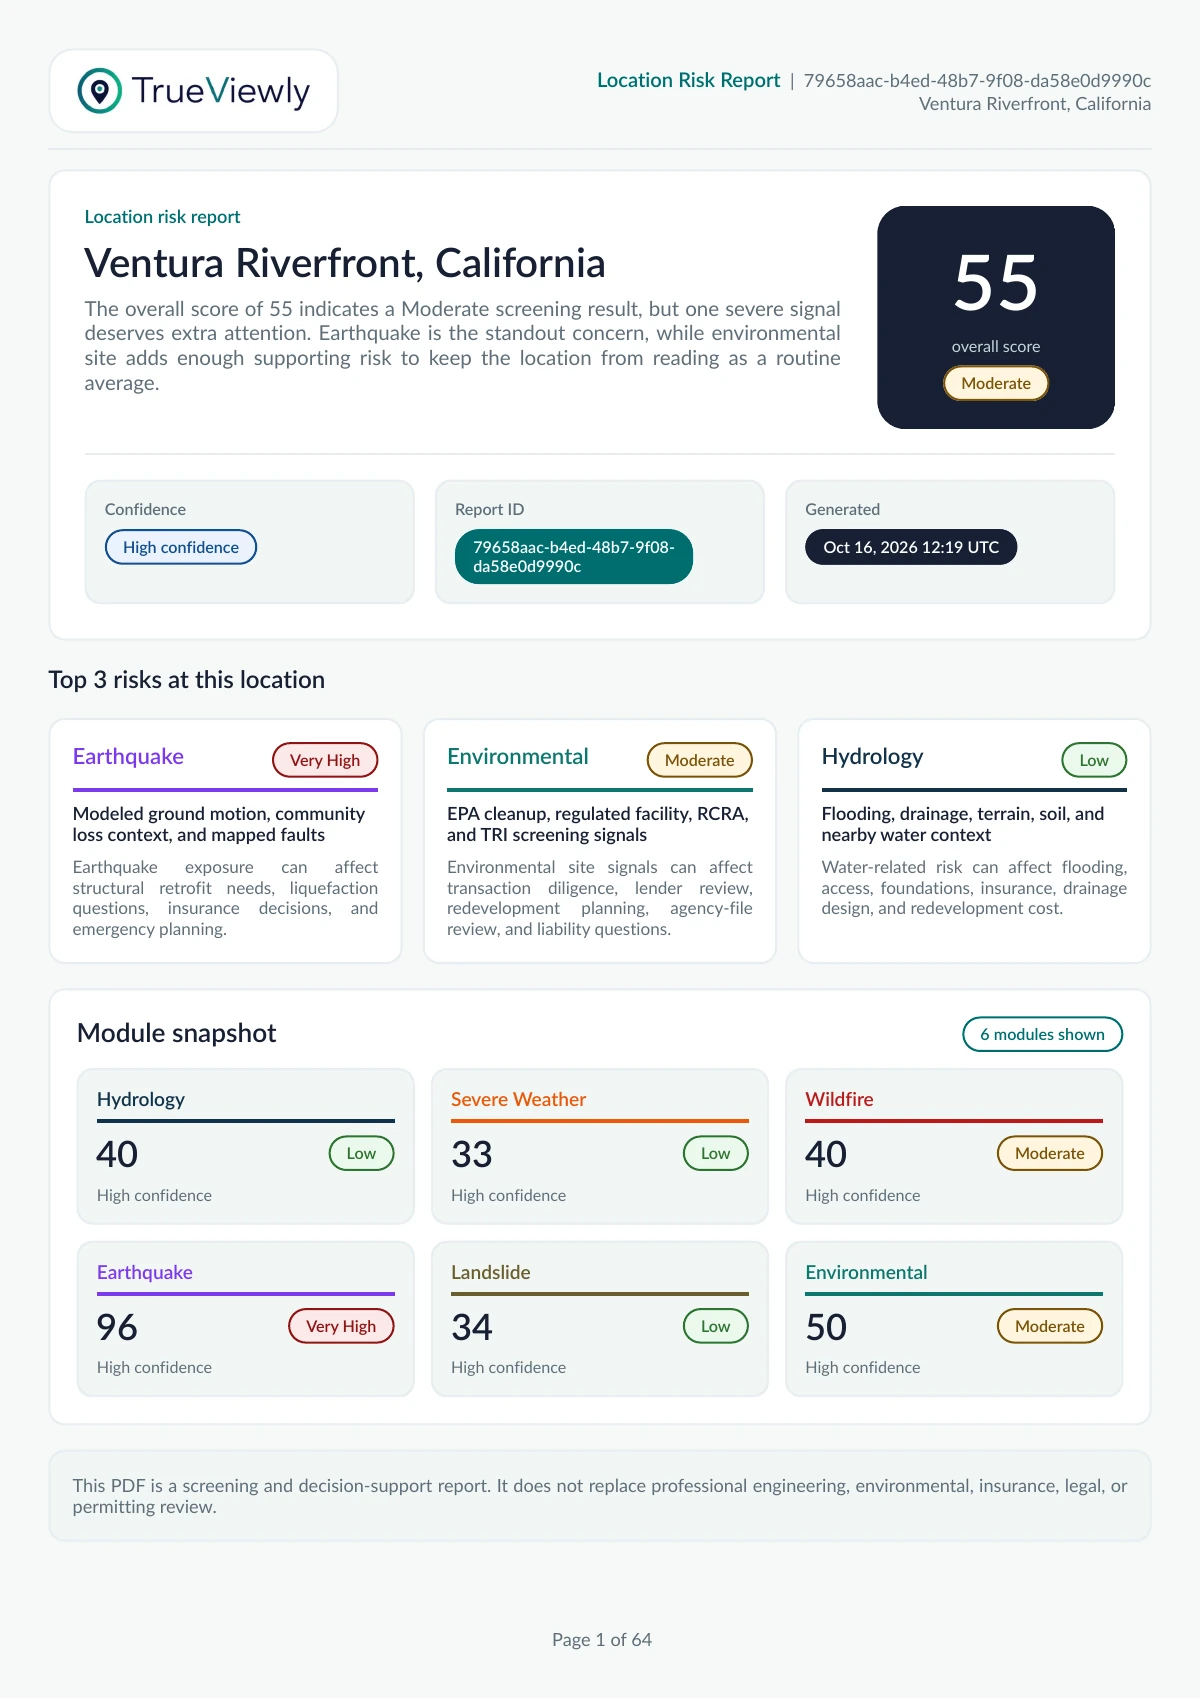
Earthquake is the standout concern, with environmental records and coastal/river flood context worth closer review. The overall result includes a concern floor; it is not a probability of damage.
High confidence describes source coverage, not certainty about future losses.
A saved screening example, not a forecast, parcel inspection, engineering opinion or insurance determination. Values reflect the sources available when this report was generated.
These are 0-100 screening indices, not probabilities. The overall score uses configured weights and concern-floor rules rather than a simple average.
Low
Low
Moderate
Very High
Low
Moderate
USDA WRC is the largest contribution to the wildfire module. FEMA NRI and historical MTBS burns provide supporting context. Burn probability is not the probability that a specific building will burn.
USGS NSHM is the largest score contribution. These values are not a building-performance prediction, and the local modeled Vs30 estimate has not been used to amplify them.
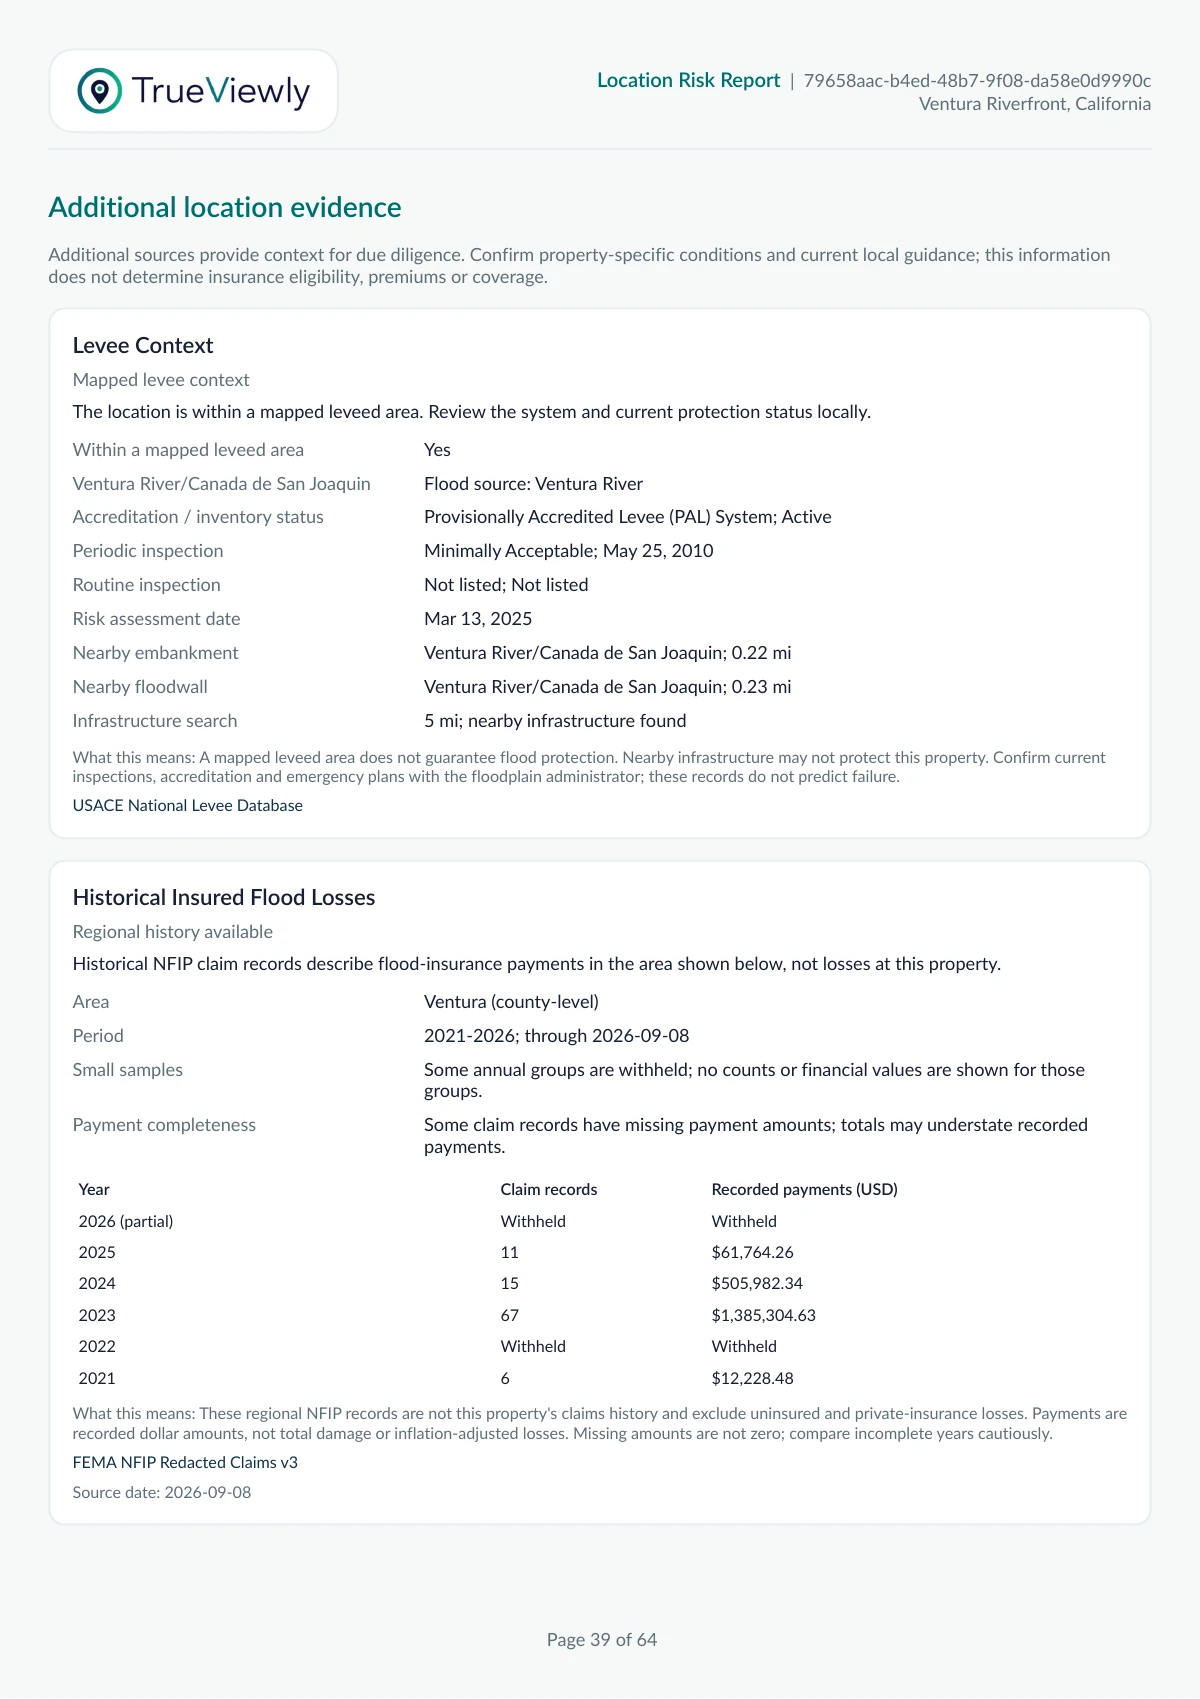
The nearby 13.0 ft BFE line, 0.23 mi away, is context only, not the location's assigned flood elevation or a design constraint. Zone X and a lower hydrology score do not establish that a property cannot flood.
These records support property-specific follow-up, not insurance eligibility, pricing or coverage decisions.
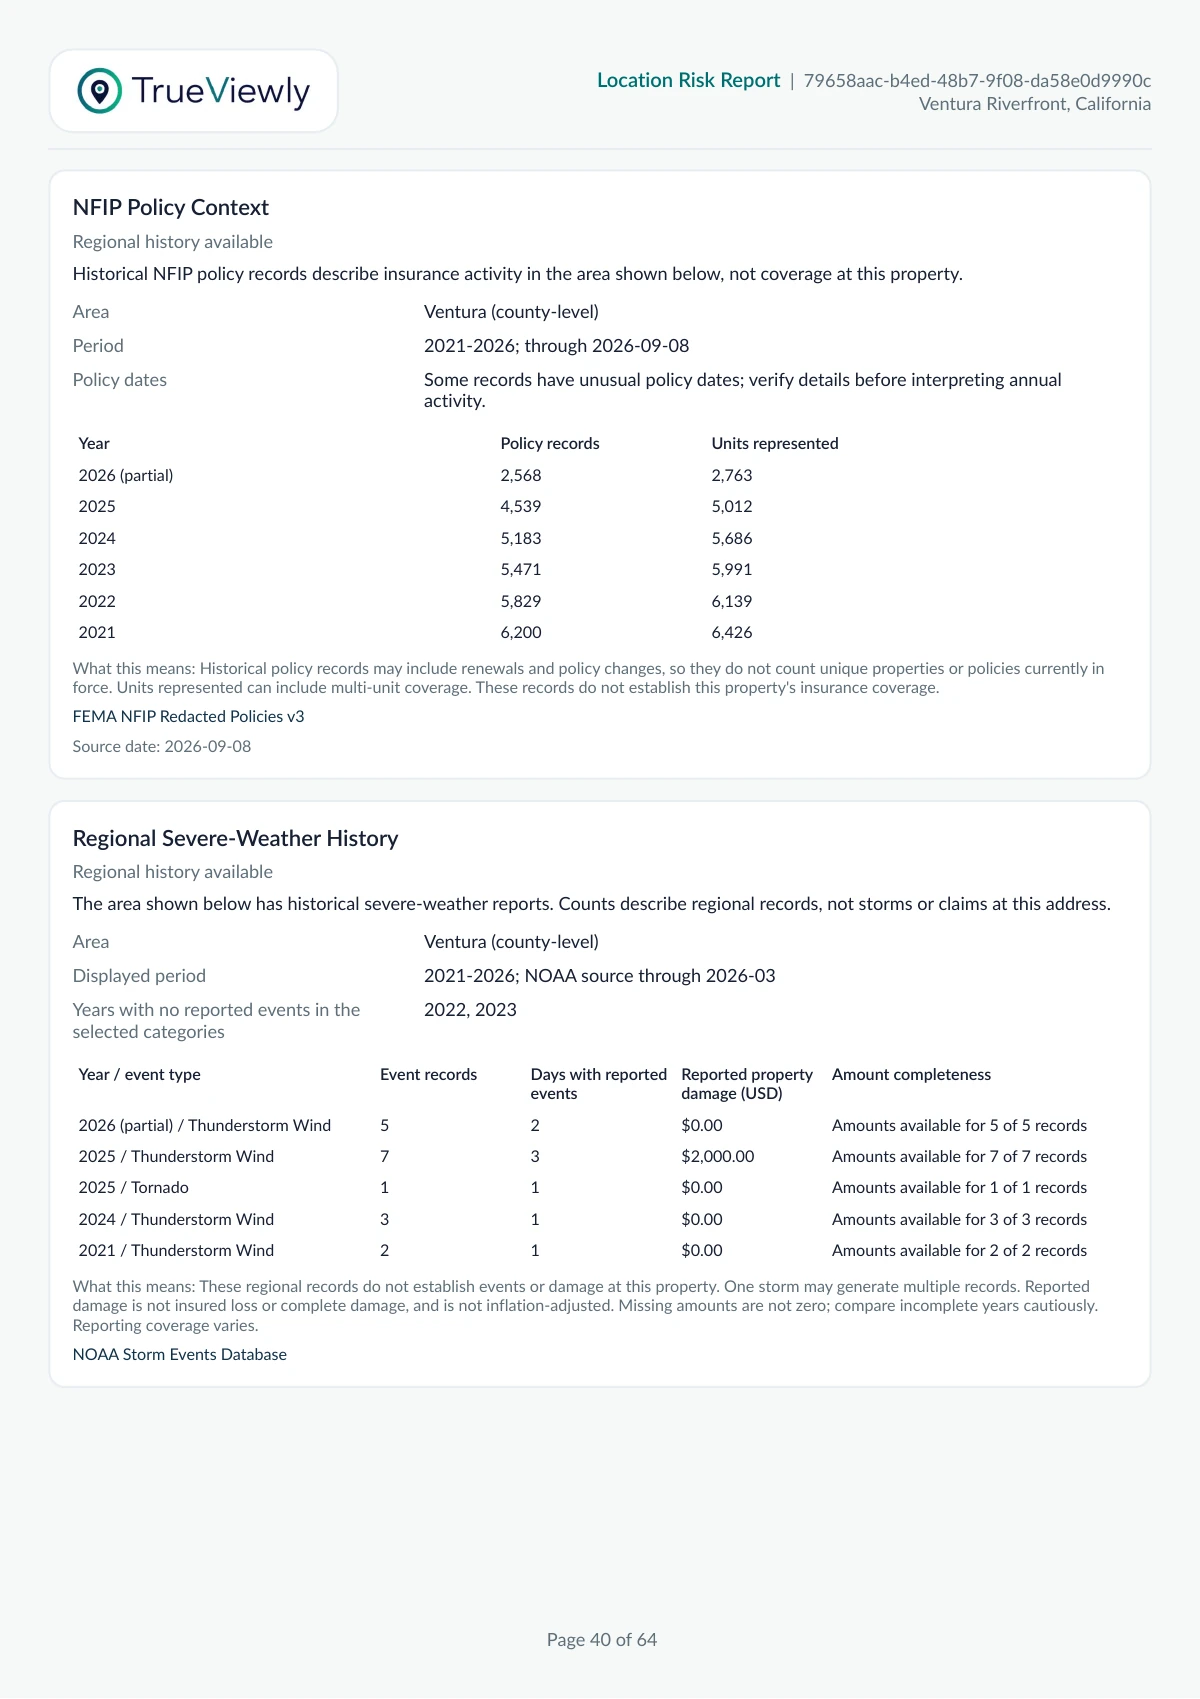
Ventura County (06111) · 2021-2026 · Source snapshot 2026-09-08. Claim groups below five records are withheld. The 2026 snapshot year is partial, and missing payments are not zero.
| Year | Claim records | Recorded gross payments (USD) | Policy records | Units represented |
|---|---|---|---|---|
| 2026 (partial) | Withheld | Withheld | 2,568 | 2,763 |
| 2025 | 11 | $61,764.26 | 4,539 | 5,012 |
| 2024 | 15 | $505,982.34 | 5,183 | 5,686 |
| 2023 | 67 | $1,385,304.63 | 5,471 | 5,991 |
| 2022 | Withheld | Withheld | 5,829 | 6,139 |
| 2021 | 6 | $12,228.48 | 6,200 | 6,426 |
Payments are recorded components in nominal USD, not total flood damages. Policy records and represented units are not unique properties or current policies-in-force. Do not divide claims by these records to infer a loss rate. Some payment amounts are missing, so totals may understate recorded payments. Read the NFIP history guide.
Ventura County · 2021-2026 · NOAA source through 2026-03. Thunderstorm-wind records appear in 2021 (2), 2024 (3), 2025 (7) and partial 2026 (5); one tornado record appears in 2025. Reported property damage is $2,000 for 2025 wind records and $0 for the other displayed groups, not proof of no damage. No events were reported in the selected categories for 2022 or 2023.
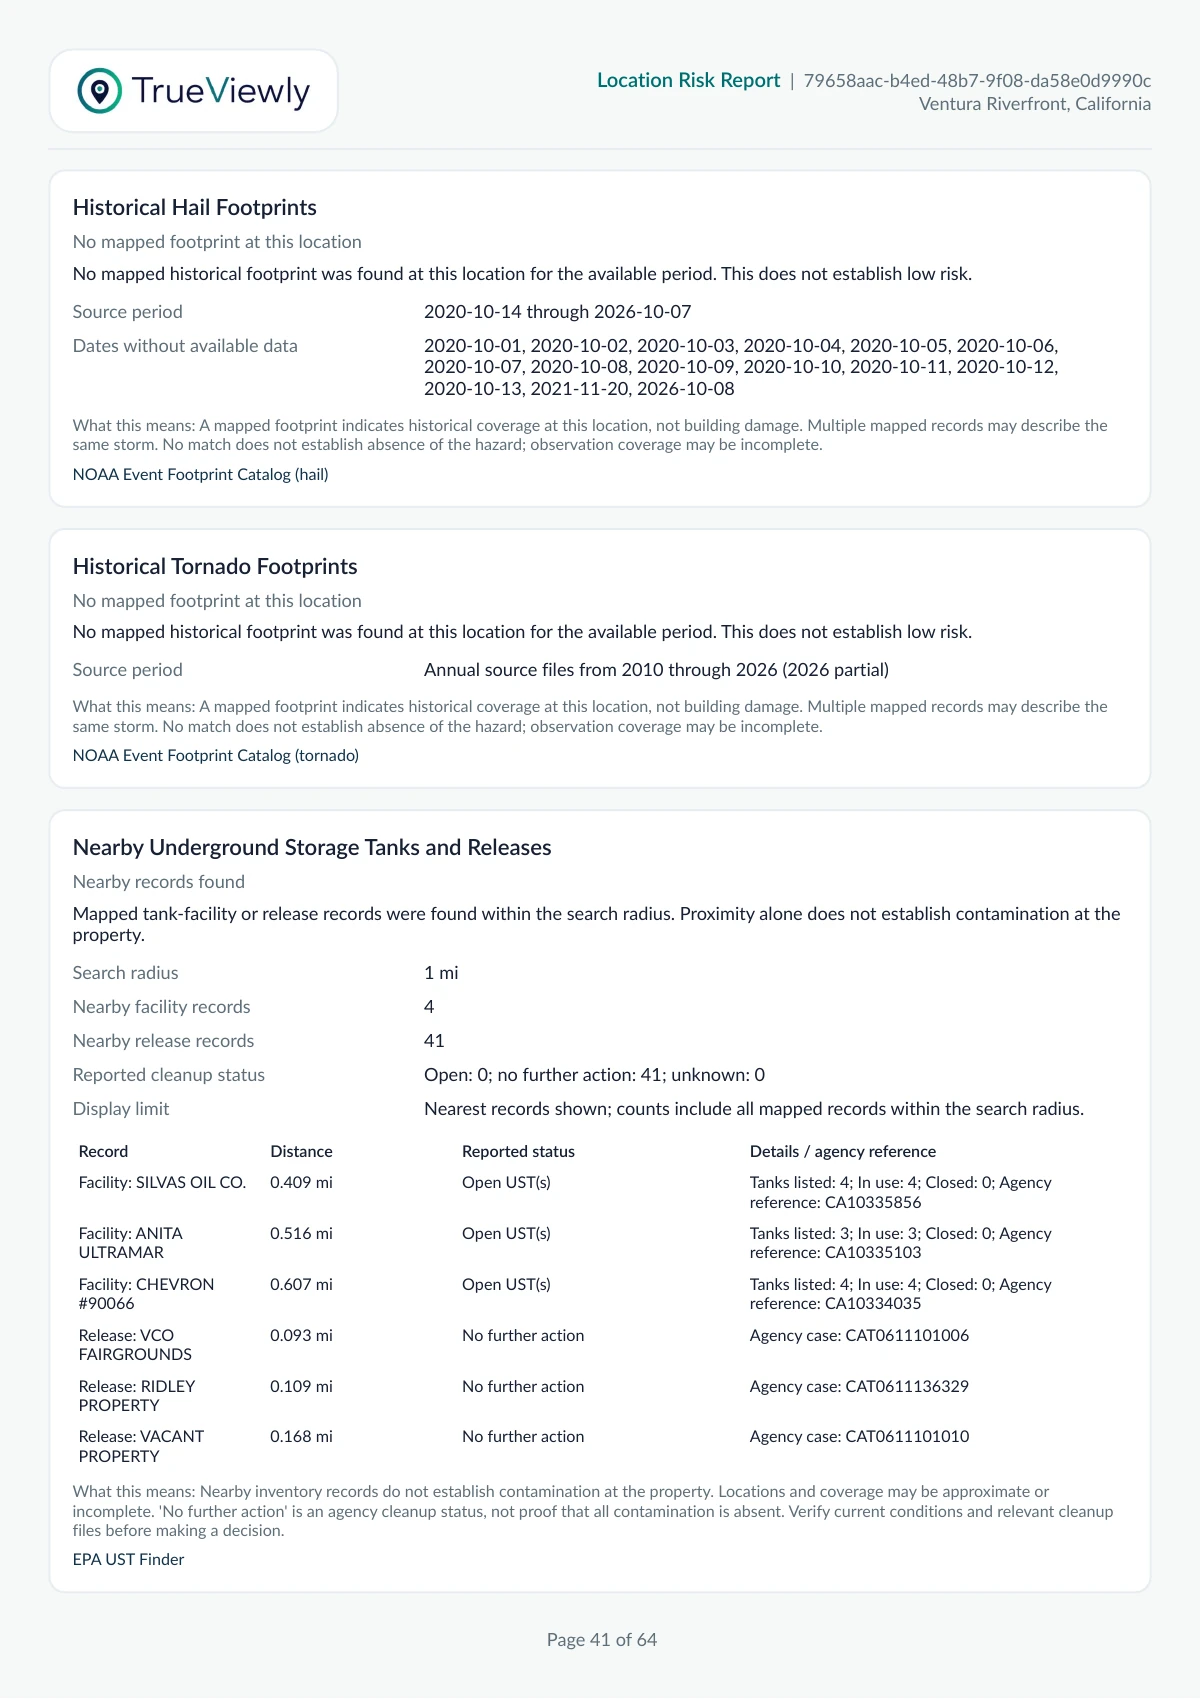
County summaries exclude forecast-zone-only records. Regional event records and hail hourly/intensity polygons are not independent storm counts, property claims or annual loss probabilities. Footprint matching uses no nearby buffer; no match does not establish safety or complete observations. Read the storm-history and footprint guide.
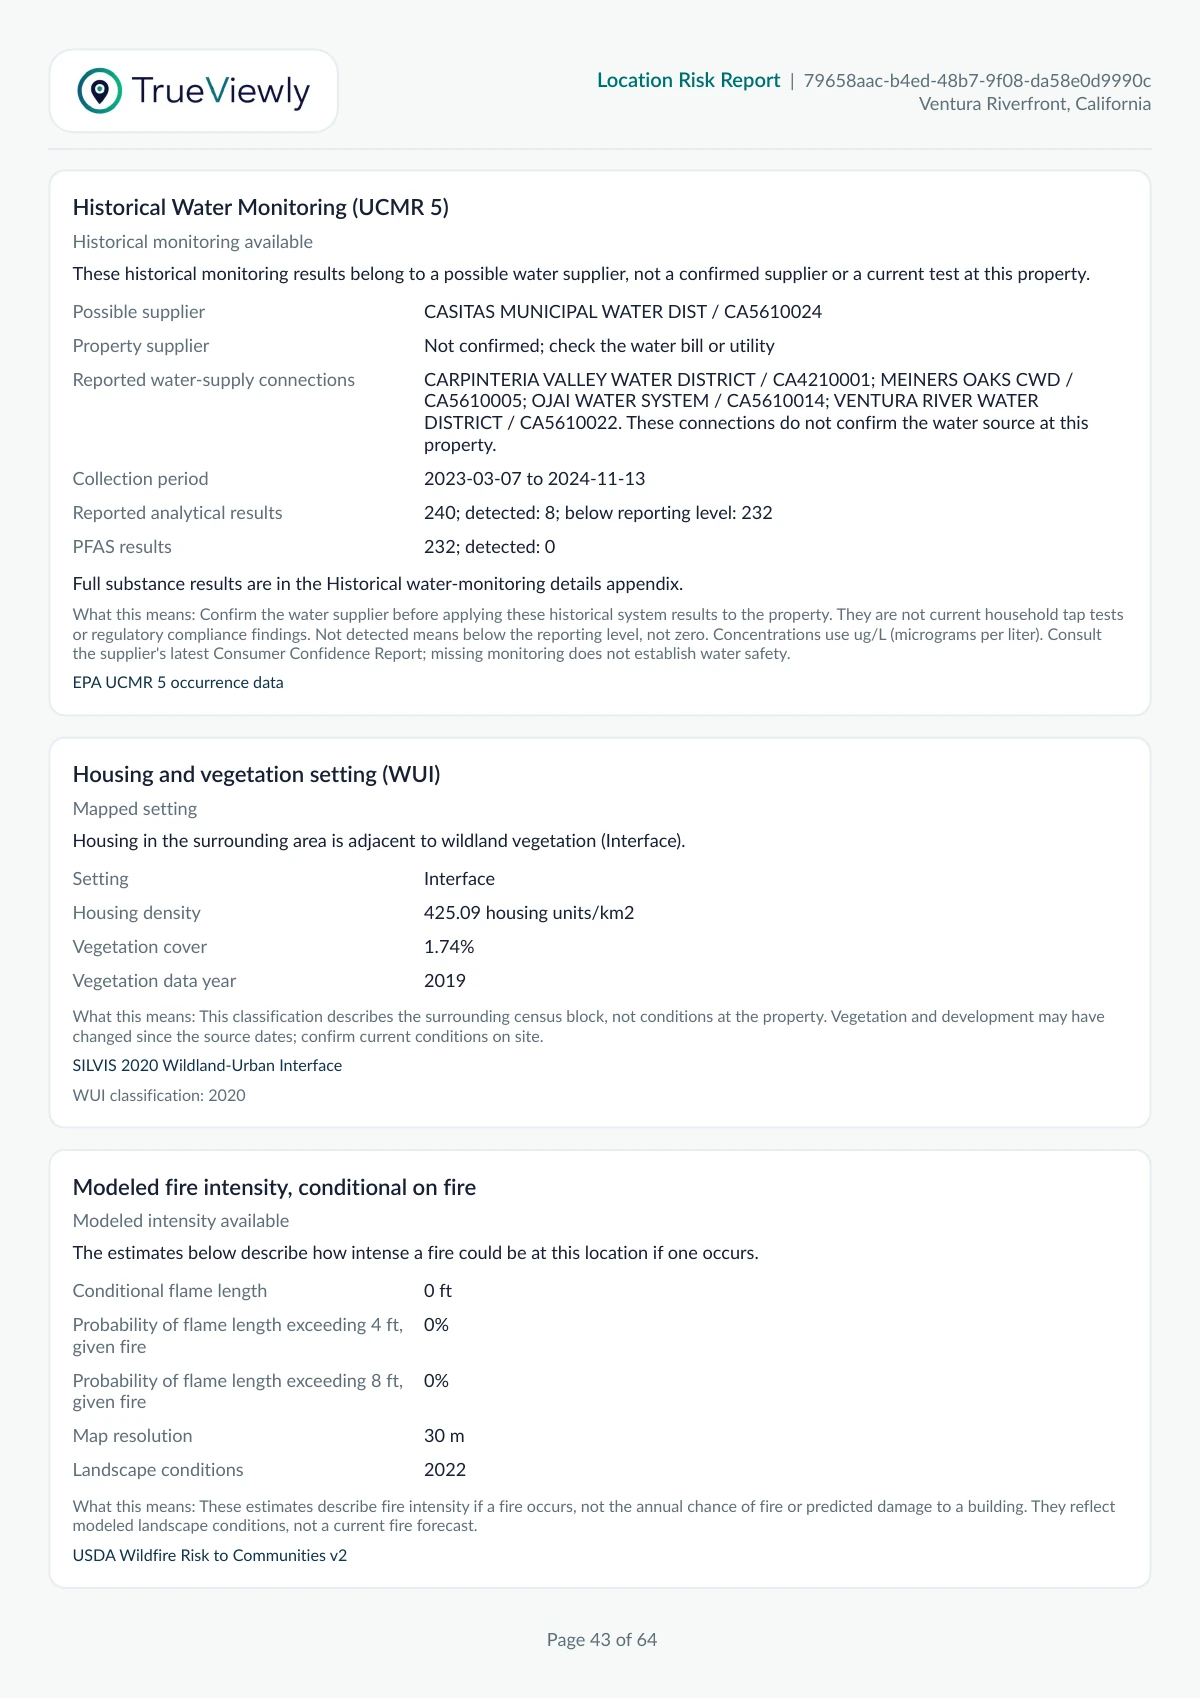
The annual burn probability above describes whether a modeled location cell burns. WUI describes its surrounding housing and vegetation setting. Conditional flame length describes intensity if a fire occurs, not the chance of one.
The published 2020 classification describes the surrounding census block, using 2019 vegetation data here. It is not a current inspection of this parcel.
USDA WRC estimates at a 30 m cell, reflecting 2022 landscape conditions. These percentages are conditional on fire, not annual burn probabilities or forecasts of building damage.
The lower modeled flame length does not cancel the 40/100 wildfire score. The score also reflects annual modeled risk, community exposure and historical burn context.
Confirm current vegetation, defensible space, ember pathways, roof and vent details, access and evacuation options with qualified local professionals. Read the wildfire evidence guide.
WUI and conditional intensity are supporting evidence, separate from the score. Non-WUI, a modeled zero or no available estimate must not be interpreted as proof of safety.
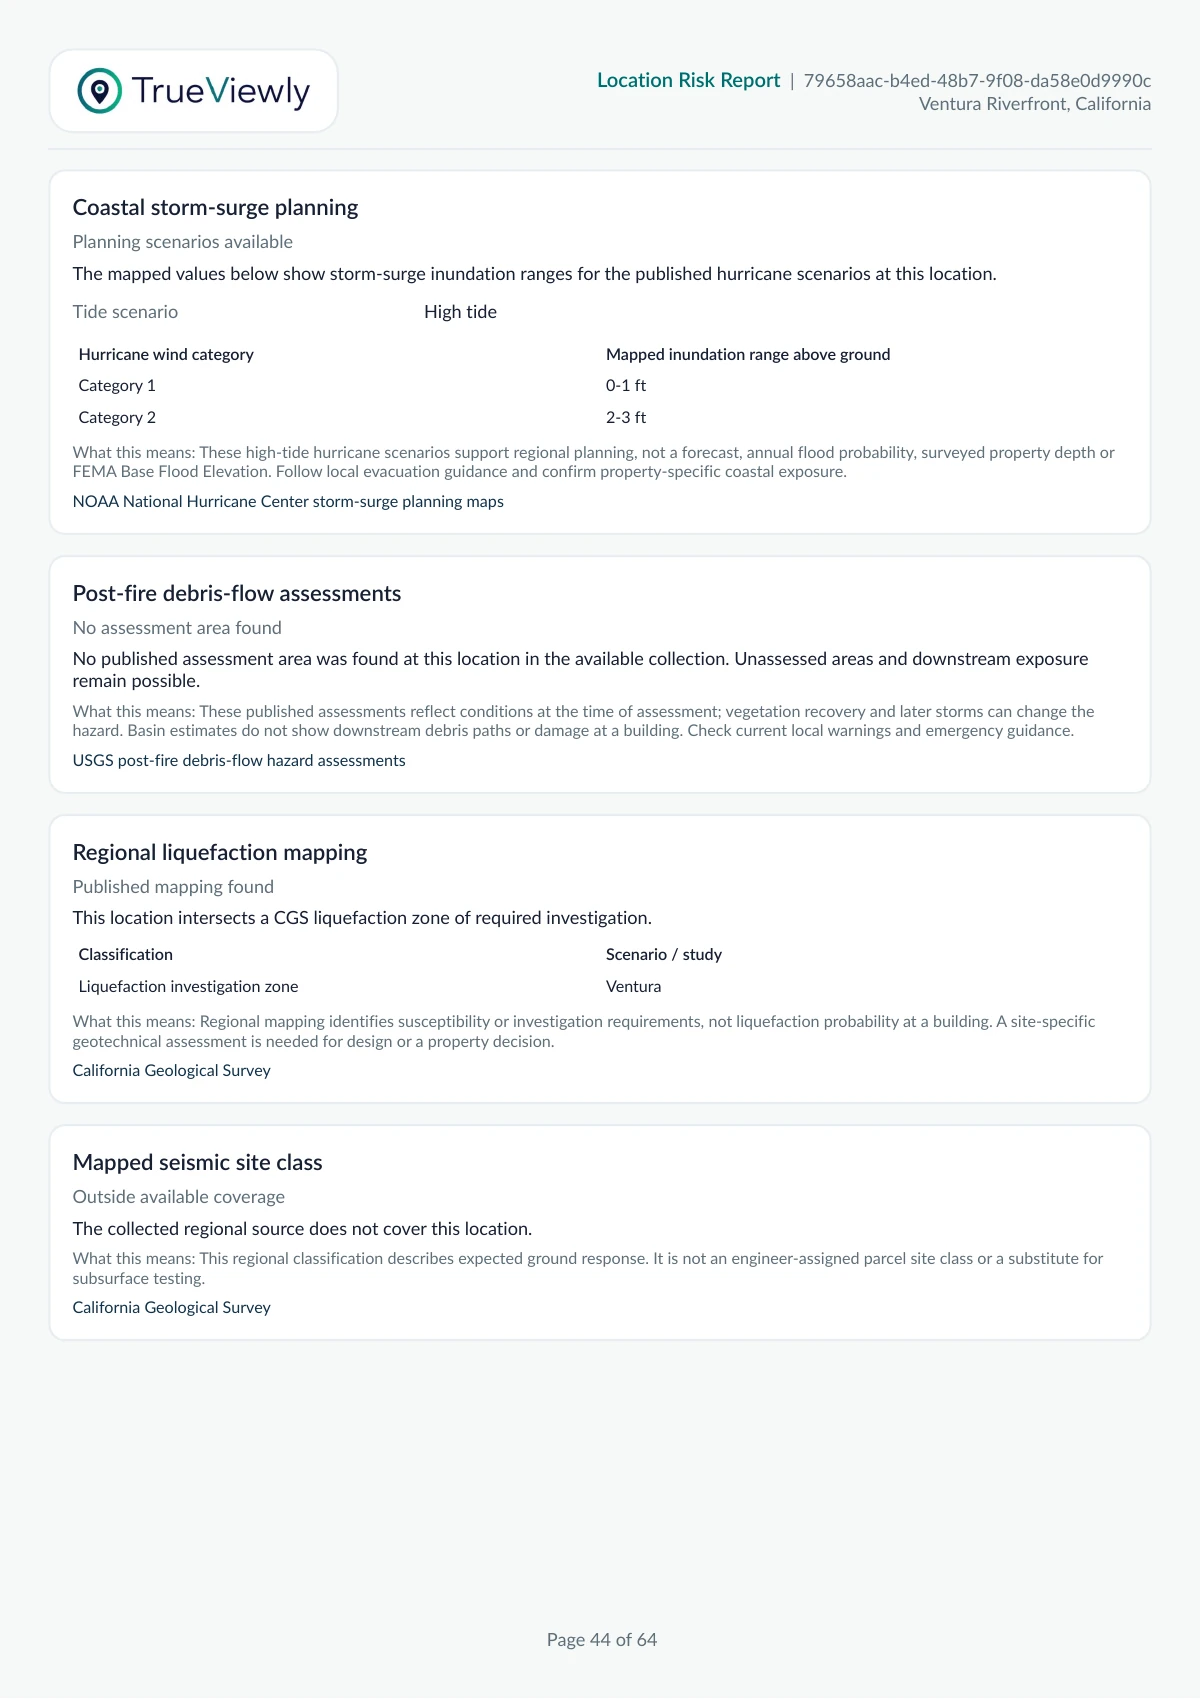
Coastal storm-surge scenarios and published post-fire assessments answer specific questions. This riverfront example has mapped coastal and ground-hazard findings, alongside sources that do not cover the point. A no-match must not become a zero-risk result.
High-tide scenarios show 0-1 ft above ground for hurricane Category 1 and 2-3 ft for Category 2. These are regional planning ranges, not annual probabilities, surveyed building depths or FEMA Base Flood Elevations.
No published assessment area was matched here in the available collection. That is not a basin estimate of zero and does not rule out an unassessed area or downstream exposure.
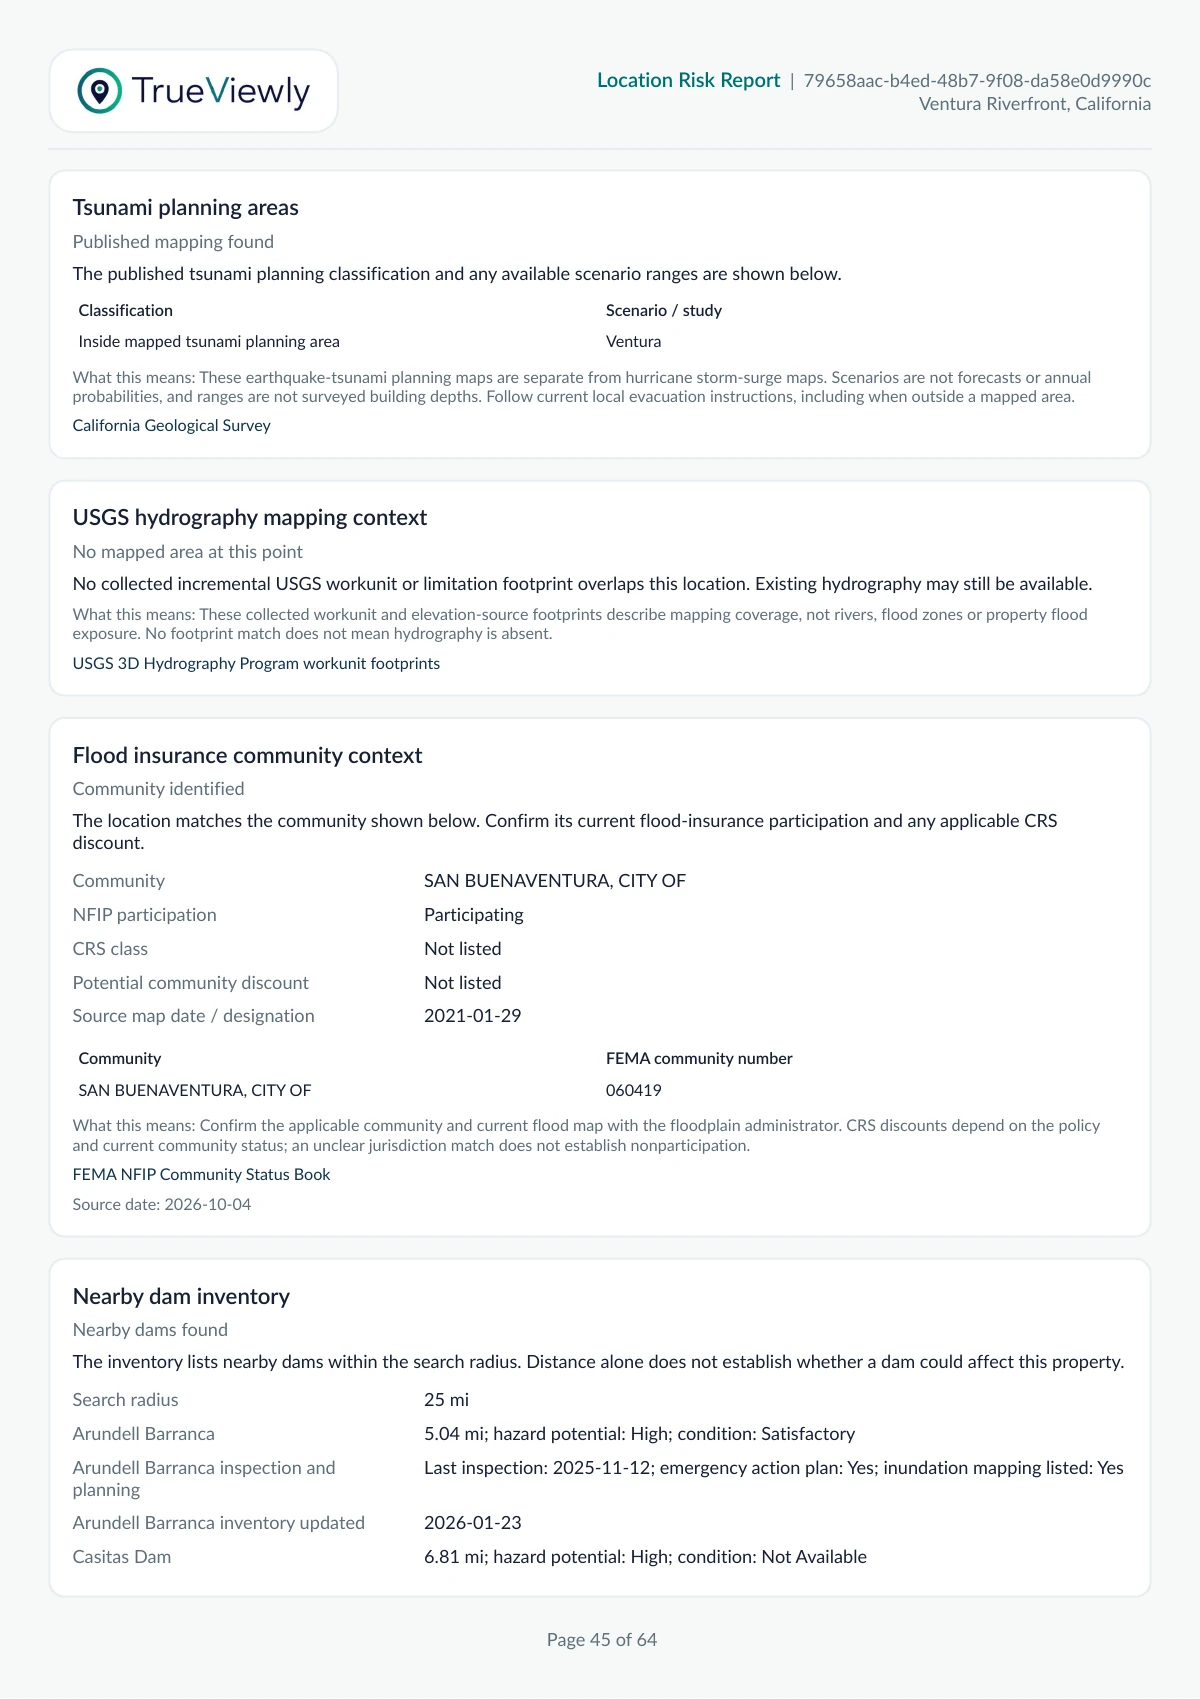
The Ventura study identifies investigation and emergency-planning questions, not a probability of damage at a building. Tsunami mapping is separate from hurricane storm surge. Obtain site-specific geotechnical advice and follow local evacuation guidance. Read the regional map guide.
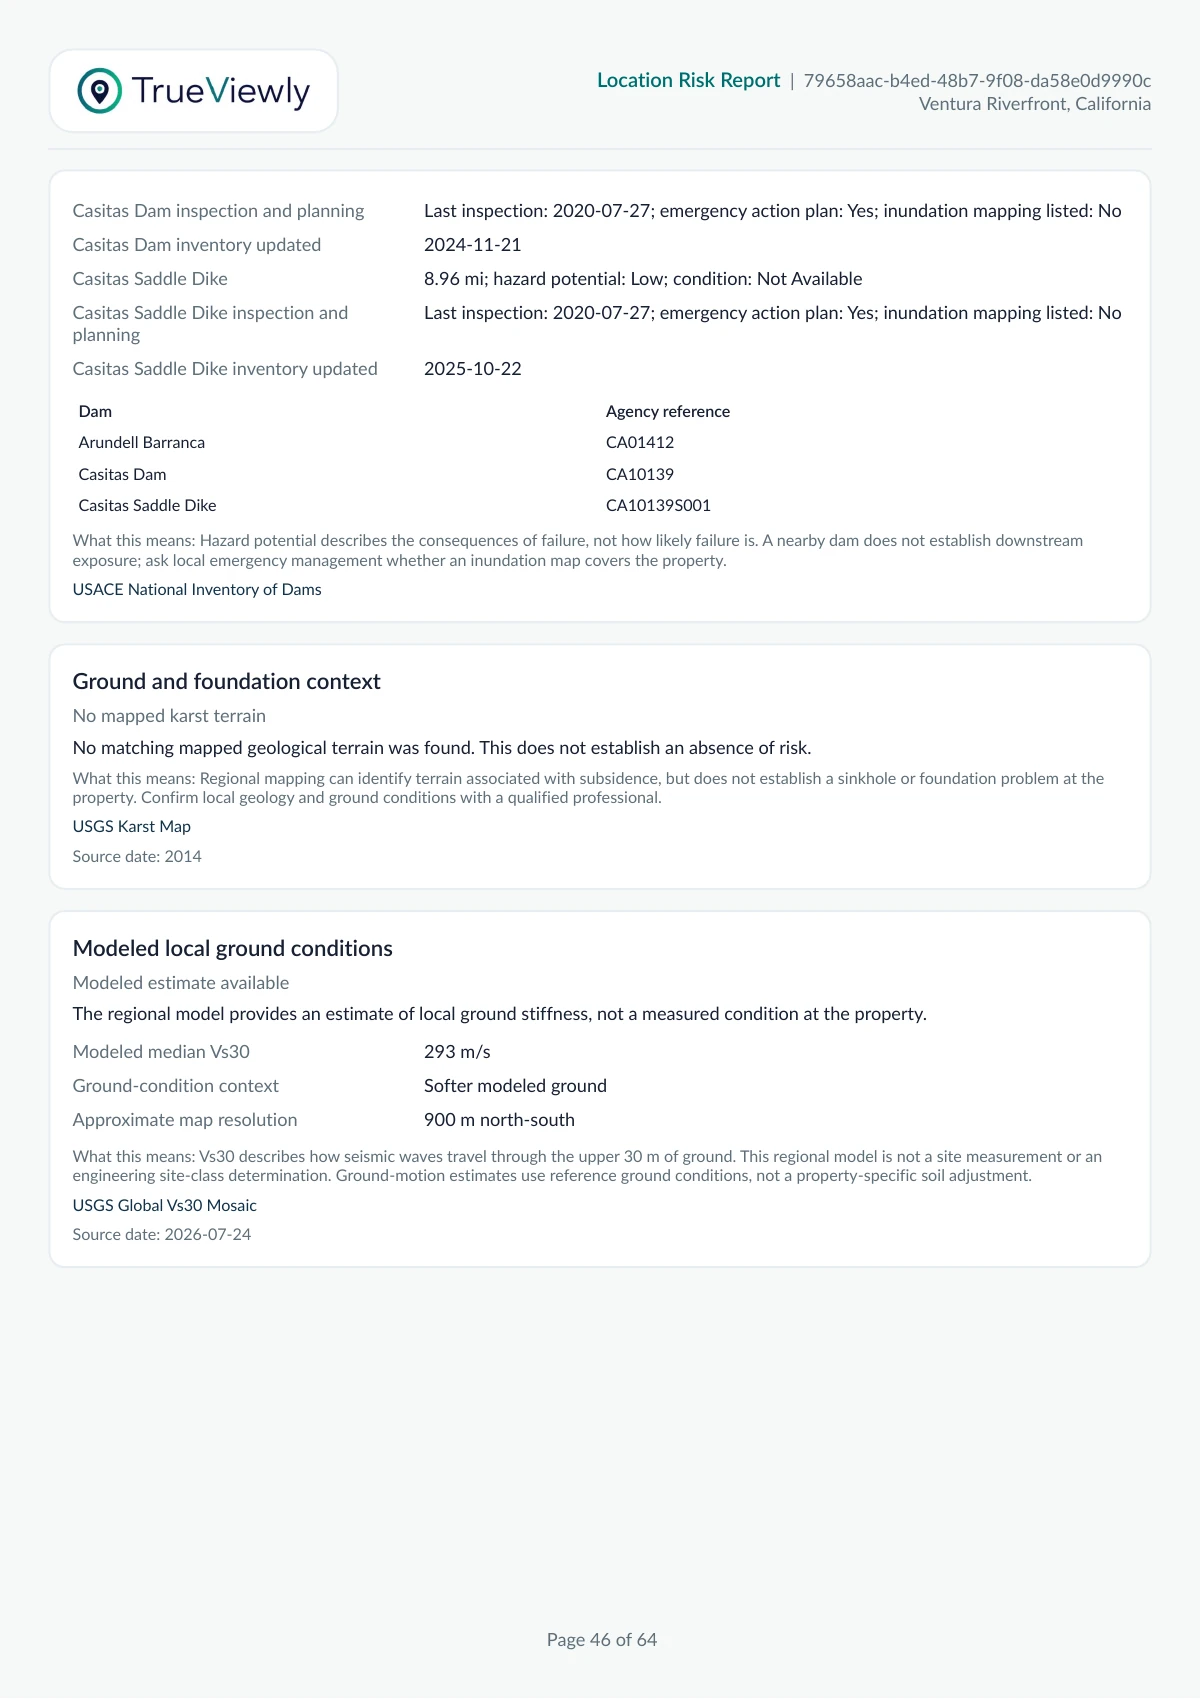
Regional seismic site-class mapping is unavailable here, and no collected USGS 3DHP workunit footprint overlaps the point. Neither finding means ground hazards or hydrography are absent. Read each estimate with its source coverage, date and scenario. For current conditions, follow official local warnings and emergency guidance.
The Environmental score is 50 (Moderate). Nearby release records and conditional water monitoring add evidence for follow-up, not a contamination finding or a water-safety rating.
All 41 nearby release records carry a no-further-action source status. That does not prove contamination is absent. Coordinates may be geocoded; counts describe source records, not distinct incidents or property exposure. Read the UST guide.
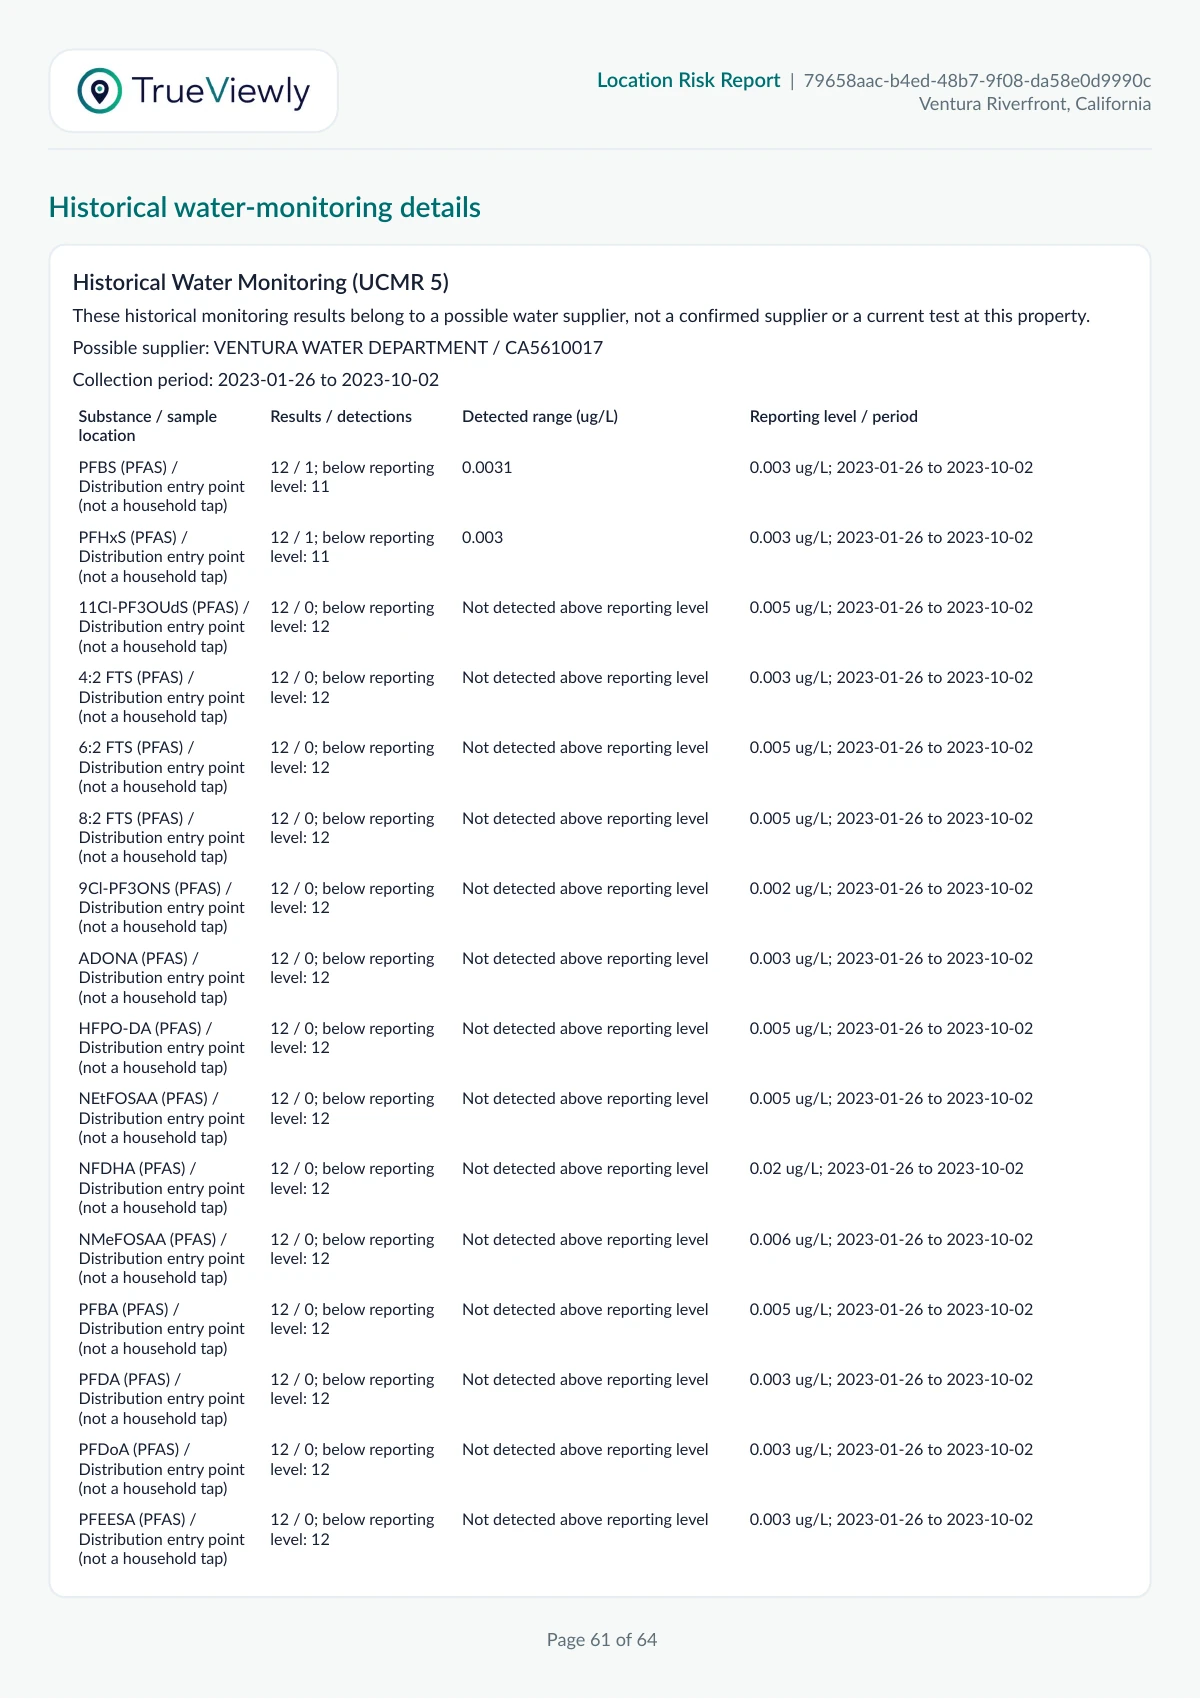
One of two mapped candidates, not a confirmed supplier. Historical system results are not household tap tests or a current compliance finding. Read the water-monitoring guide.
One of two mapped candidates, not a confirmed supplier. Historical system results are not household tap tests or a current compliance finding. Read the water-monitoring guide.
Keep the two candidate histories separate; they do not identify the property's supplier. Detection records are not affected properties or independent household samples. Non-detects mean below the reporting level, not zero concentration. Lithium is not PFAS. Confirm the supplier and obtain its latest Consumer Confidence Report before making a property-level interpretation. Review nearby release files with an environmental professional.
The report's weighted module result is 45.00. A 95+ earthquake result together with another elevated module activates the existing multi-module concern floor, raising the overall result to 55.
Separately rounded display rows need a -1 reconciliation. It is a display adjustment, not extra hazard evidence.
| Component | Points |
|---|---|
| Hydrology | 14 |
| Severe Weather | 7 |
| Wildfire | 6 |
| Earthquake | 10 |
| Landslide | 2 |
| Environmental | 7 |
| Multi-module concern floor | +10 |
| Display rounding adjustment | -1 |
| Overall location risk | 55 |
Check building age, structural system, retrofit history, local liquefaction maps and insurance needs with qualified professionals.
Confirm current flood maps, levee protection status, property elevations and tsunami evacuation routes. Hurricane surge and earthquake-tsunami scenarios are separate.
Confirm the water supplier and latest Consumer Confidence Report; review relevant cleanup files. Check drainage, current vegetation and wildfire access, and test indoor radon.
Selected pages from the same 64-page report. Each image opens at full size; important findings above remain readable as text.
This is a generated snapshot, not a live hazard feed. Your report depends on location, coverage and available source records. Read the methodology and limitations.